WOW2022 W33 Tableau vs. PowerBI
WOW2022 W33 Tableau vs. PowerBI
Workout Wednesday 2022 Week 33 challenge by Lorna Brown originally done in Tableau, also recreated in PowerBI.
This blog aims to highlight the similarities and differences between both softwares. A big thank you to Lorna for her encouragement and support to create this post.
Preparation
Tableau
Other than hiding all the fields that are not required, there was no preparation needed.

Power BI
First thing, I also removed the columns that are not needed for this exercise.
As this visual requires several date operations I created a date table.Here lies one of the main differences between Tableau and Power BI. Power BI gives you more flexibility to design and expand your data model. With the additional date table I have more control over the format of the date values I need and also I can reference the fields I need for date operations rather than create a separate calculation for that.
This script creates a calendar table from the minimum order date to the maximum order date with additional date fields.

Next I had to create a relationship between the two tables on Date and Order Date to be able to filter the Orders table based on the Date table.

Last thing, i created a Total Sales measure

Calculating the moving average
Tableau
Using default table calculation it is not even necessary to create the calculation from scratch.
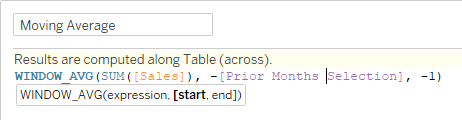
Just doubleclick Sales, select Quick Table Calculation -> Moving Average and drag the result to the data pane.

As we do not want to include the latest month, I set the end to -1. The start value will be changed later to enable the selection of the prior X months.

Power BI
In Power BI the calculation to be built from scratch.
We want to average the sales amount across the date table which can be done using the AVERAGEX function.
Extending the filter context to the period for calculating the average, the period needs to be specified with the function DATESINPERIOD.
The last month should be excluded. This is where the date table comes into play.
Setting the StartDate to End of previous Month will take care of that.
To extend the filter context to this period, the AVERAGEX calculaction needs to be wrapped with a CALCULATE function.
Prior Months? Selection
Tableau
In Tableau i created a parameter with Data Type integer and a range from 2 to 12.

I then replaced the fixed value for the range start with the parameter
Power BI
An equivalent to Tableau's parameters does not exist, so I decided to use a slicer for the month's offset selection.
First i had to create a table with months range.
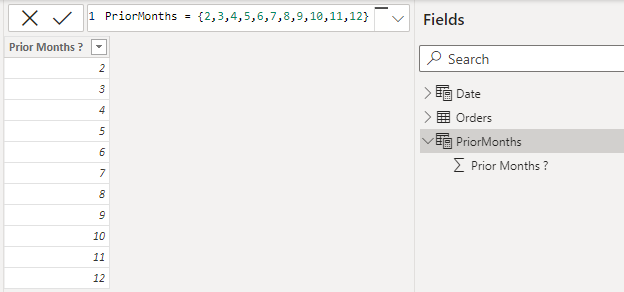
With the SELECTEDVALUE function, i then can use the value in my DATESINPERIOD calculation
For better readability, i used variables in my calculation and the end result looks like this:
Building the visual
Tableau
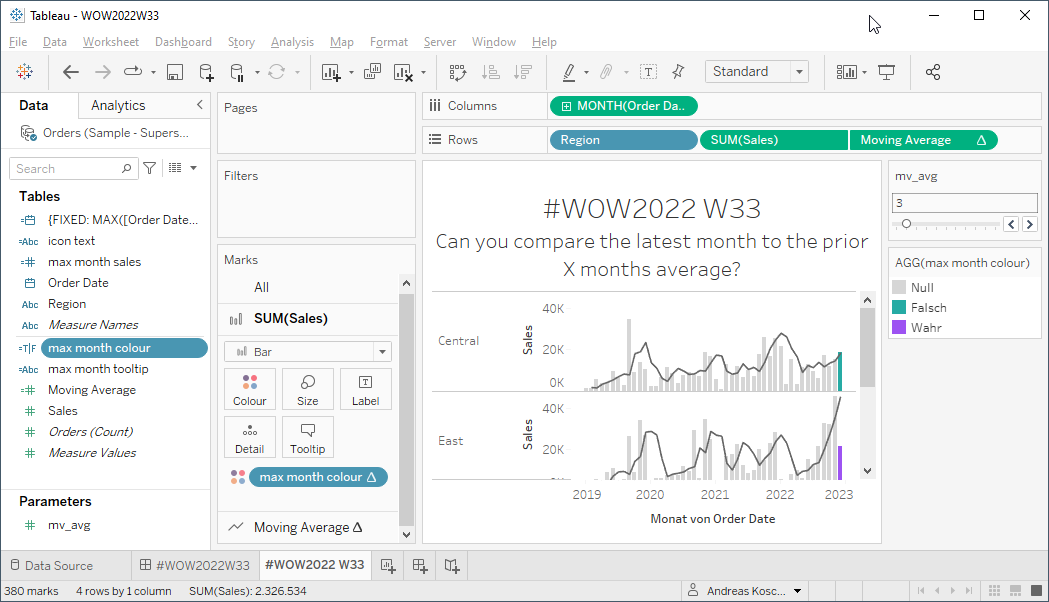
In Tableau I built a dual axis chart with the Sales and Moving Average measures.
To have separate charts for each Region, I added the Region dimension to the rows.

Power BI
In Power BI I used the Line and clustered column chart that is already predefined.

After adding the Moving Average to the y-axis, no line is shown in the visual.
That is because there is no selected value added to the filter context yet.
After adding a slicer with the Prior Months value, the line is shown based on the selected slicer value.

To separate the visual by Region, I added the Region to the Small multiples section of the Line and clustered column chart visual.

Color highlight the last month
Depending on whether sales value is above or below the average the last month should be colored accordingly. All other months should have a different color.
Tableau
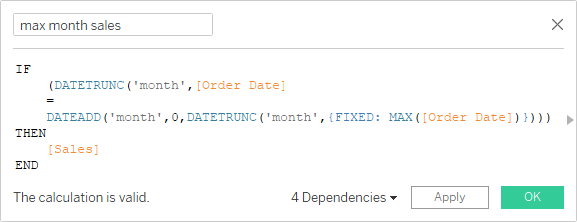
First I calculated Sales for the last (max) month.
This calculation checks for each month if it is equal to the month of the maximum Order Date.
I created a second calculation that checks if Sales is less than the Moving Average.
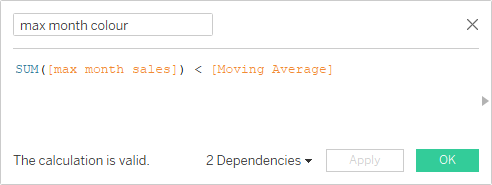
This calculation is then used to color the bars.
Power BI
In Power BI I first calculated the comparison between Sales value and the Moving Average and assigned the desired color value to both results.
In the SWITCH function, for instances where Sales is higher than the moving average, color code #26aba4 is assigned.
For everything else (Sales lower than the Moving Average) color code #9d53f2.
This alone colors all the months accordingly. Next I had to restrict this to only the latest month with a 3rd color value for all the previous months.
To get the latest month I need to calculate the maximum, removing all the filter context.
This can be done with the CALCULATE function using the ALL modifier on the Date table.
This value can be compared with the max value for each month.
If they match, the color value of my Sales vs Average measure is assigned. For everything else color value #d6d6d6.
Using Variables in my calculation I can get rid of the previous Sales vs Average measure and add it to this calculation as a variable.
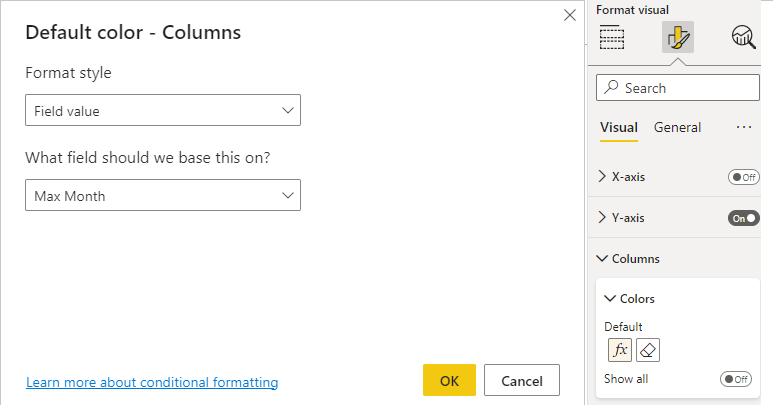
To apply the color values to the column, i used the Max Month field for conditional formatting
Tooltips
The tooltip for the last months should display if the value is above or below the prior X months average sales.
Tableau
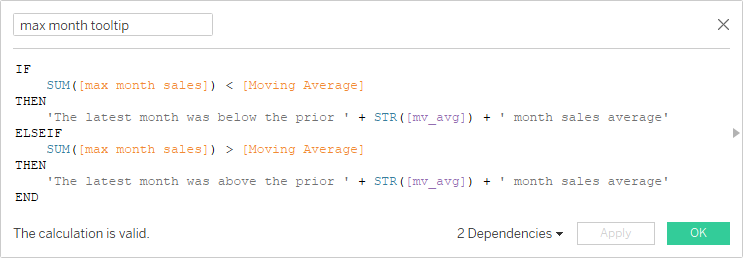
I created a calculation that uses the previous check if sales is below the average with the parameter value to display the prior months value and added this to the bar chart tooltip.
Power BI
The calculation in Power BI is quite similar.
Info icon
Tableau
For the info icon I had to create a new worksheet.
Here I entered sum(0) in the rows field and selected Shape in the Marks section.
I already imported a number of Custom Shapes, so I used one of them.

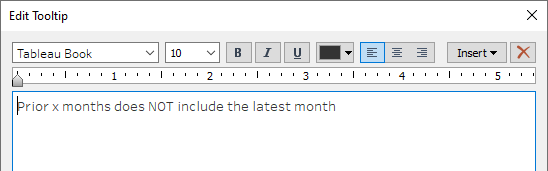
Finally i added the text to the tooltip
Power BI
In Power BI I just added a button and then added the text in the tooltip section. For the tooltip to become available I needed to enable Action. As we do not have several pages to navigate through I left the type with Back.

Conclusion
If you are used to Tableau, Power BI requires some rethinking.
For one you can easily extend your data model in Power BI. For instance, If you're working with date operations, an additional Date table is crucial.
You also have to use this approach to emulate functionality that Tableau offers out of the box, like LODs, Table Calculations, Sets and Parameters.
Then, in Power BI you have to think more about filter context to be able to achieve the results you need.
Example 1
I want to get the maximum Sales amount for Year/Month combination.
Tableau
I created a FIXED LOD on YM and use a MAX aggregation.

Power BI
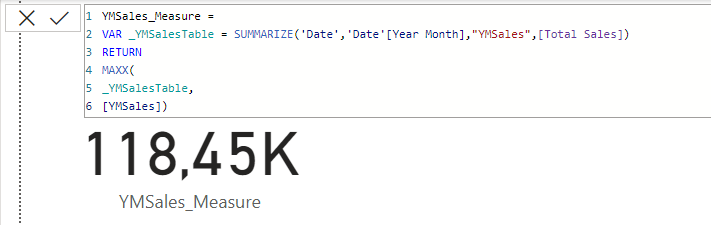
For what Tableau creates in the background with the LOD, I need to create a table in Power BI, that gives me the Sales amount by YM using the SUMMARIZE function.

Displaying the maximum value of this table gives me the same result.
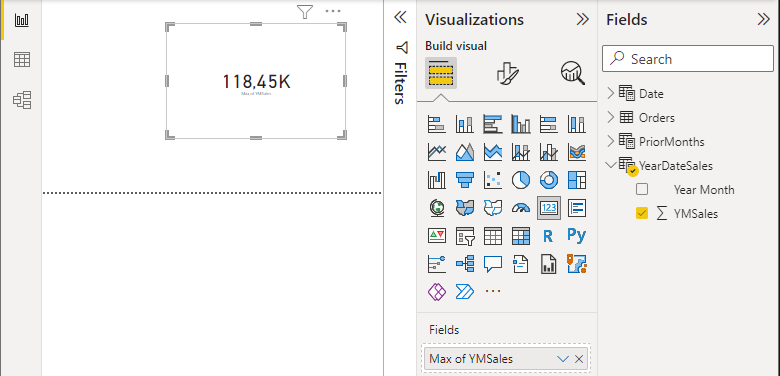
I actually don’t even need to create the table separately. I can use it as a table expression within a MAXX function to calculate a measure with the maximum YM sales value.
Example 2
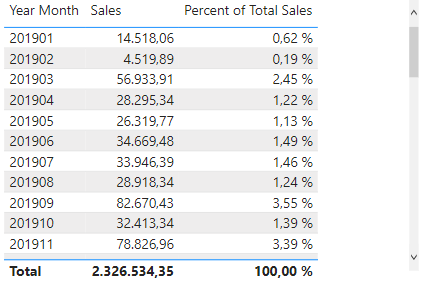
I want a table displaying sales by Year/Month and also the percentage of total sales.
Tableau
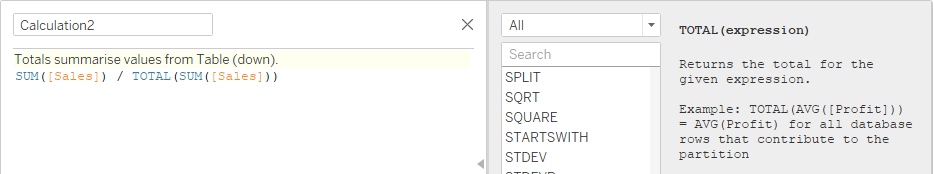
Tableau already offers a table calculation for percent of total. I just need to add Sales to the table, apply the Percent of Total table calculation, add Sales again and I'm done.

I could have also created the Percent of Total calculation easily by myself. For the total, Tableau already provides an expression.
Power BI
Here I have to calculate the Total Sales amount myself by using the ALL function to remove all the filters that might have been applied to the date table.
By adding a table with a YearDate column, I already apply a YearDate filter which I want to ignore.
The calculation looks like this:
This gives the same result as in Tableau.
I hope that this blog has helped you understand some of the similarities and differences between how to do things within Tableau compared to PowerBI.
Comments
Post a Comment