Posts

Showing posts from November, 2022

WOW2022 W45 Tableau vs. Power BI

Image
 WOW2022 W45 Tableau vs. Power BI Workout Wednesday 2022 W45 challenge by  Erica Hughes  originally done in Tableau, also recreated in  Power BI .  In this blog i describe the different approach in both tools. I might have over complicated my solution in Tableau, so any comments and suggestions are more than welcome. Preparation Tableau I had some difficulties converting the date field properly from text to date/time, so i split the field into 2 columns with space as separator.  Now i had a proper Date and Time column, but with the time format AM/PM where i needed 24H. So i created a Calculated Field for the time in 24H format. Power BI The same problem here. Trying to convert the date column produced a number of errors so i split this column in Power Query Editor. First i renamed the DATE column to _DATE so i could create a new Date column. Having 3 delimiters in the original Date Field made it easy to separate the content. I also added a custom Date table that will help me with calc
WOW2022 W37 Tableau vs. Power BI

Image
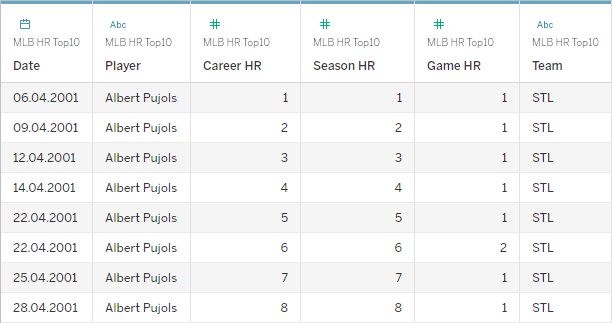
 WOW2022 W37 Tableau vs. Power BI Workout Wednesday 2022 W43 challenge by Kyle Yetter  originally done in Tableau, also recreated in  Power BI .  In this blog i describe my approach in both tools. Preparation Tableau The main challenge was to create a line chart that displays a player’s Career HR by the number of days since their 1st MLB home run without using table calculations. As the Career and Season HR are already present as a running total in the dataset, the first thing I needed to take care of was creating an axis where all players have the same starting point. To get the starting point i created a calculation that gave me the MIN (start) date for each player. For the continuous value for my x-axis i subtracted the minimum date from the date, resulting in a continuous value for each player, starting with 0 up until the end of their career in the observed time period. To build the basic graph i added the Timeline calculation to columns, Career HR as dimension to the rows and Pla

WOW2022 W43 Power BI vs. Tableau

Image
WOW2022 W43 Power BI vs. Tableau Workout Wednesday 2022 W43 challenge by  Jeremy Anderson   originally done in Power BI, also recreated in Tableau.  This blog aims to highlight different approach in both tools. In the original challenge the visualization compared Sales from the current year with Sales from the prior year. I added a year selection to be able to compare previous years with their respective prior year. Preparing the measures Power BI First thing, i created a date table that will help me with my calculations. Current Year and Previous Year were needed for the original challenge. I won't need them in my example. Next i created another table that will be used for the year selection. The Sales calculation for the selected (current) year calculates the Sales amount where the year equals the selected year. Selected Year Sales = CALCULATE (     [Total Sales] ,     FILTER (         'Date' ,         YEAR ( 'Date' [Date] )             = SELECTEDVALUE ( &#