WOW2022 W37 Tableau vs. Power BI
WOW2022 W37 Tableau vs. Power BI
Workout Wednesday 2022 W43 challenge by Kyle Yetter originally done in Tableau, also recreated in Power BI.
In this blog i describe my approach in both tools.
Preparation
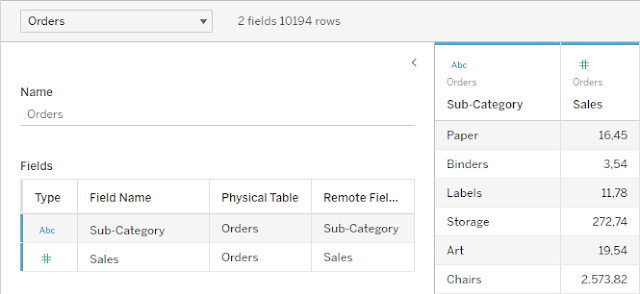
Tableau
The main challenge was to create a line chart that displays a player’s Career HR by the number of days since their 1st MLB home run without using table calculations.
As the Career and Season HR are already present as a running total in the dataset, the first thing I needed to take care of was creating an axis where all players have the same starting point.

To get the starting point i created a calculation that gave me the MIN (start) date for each player.


To build the basic graph i added the Timeline calculation to columns, Career HR as dimension to the rows and Player names to Colour.
As we have one Career HR value per date and i just son't want them to summarize i could also have added the average or max Career HR.

Power BI
To get the continuous value i need for the x-axis of the graph i created a new column.
I calculated the minimum date, removing all the filter context, except for the Player, leaving me with the start date for each player. Then i subtracted this from the date column.

I then added the Timeline column to the X-axis of a line chart, the Average of the Career HR to the Y-axis and the Player names to the legend.

Adding player selection and highlighting
Tableau


This calculation was then applied to colours and the player name to details. The colours for the players were already set, i just needed to add a gray colour to the 'other' value.

Power BI

On the coloured chart i only want to display the line for the selected player.
I added this measure to the Y-axis instead of the average Career HR.


Highlight player's best HR season
Tableau

And used this to calculate the difference to the minimum date.

This calculation is then used to create a dual axis chart.


Power BI
The 2nd column displays the 'Timeline' value (difference between date and min date) where the MAX Saeson HR score matches the Season HR value.

I copied the coloured line chart with the player selection and replaced the X-axis field with Season HR Timeline.


Comments
Post a Comment