Power BI vs. Tableau - Why Sets are so powerful
Power BI vs. Tableau
Why Sets are so powerful
Watching the video Display Sales for Top Products and Others from Chandeep Chhabra, i was intrigued by his solution to the problem.
As there's quite some preparation needed for the desired outcome in Power BI i was wondering how i would tackle this in Tableau. The answer is by using Sets.
In this article i want to document the approach in both tools. Although Chandeep provides a comprehensive walkthrough, I'll create the Power BI visual from scratch for better comparison.
The Challenge
Chandeep created a visual that displays the Sales of the top n products and all remaining products as 'Others'. The result is sorted by Sales amount, with 'Others' at the last position.
In order to make it easier and to focus on the essentials, I have focused on the top 5 instead of the top n for my example.
As dataset i used the Sample Superstore from dataworld.
Preparing the dataset
Tableau
I only need Sales and Sub-Category for this visual, so i hid all the other fields.
Power BI
I also removed the columns that are not needed.
There is more preparation needed, which i don't want to start with just yet because it's not apparent yet why this is necessary.
Getting the Top 5
Tableau
To get the Top 5 i could just add a Top filter, but that would not give me the 'Other' value.
This is where Sets come into play. First I create a Top 5 set on Sub-Category. That gives me a True value for all Sub-Categories with the Top 5 Sales amount and a False value for everything else.
I then can use this Set in a Calculated Field to get only the Top 5 and Other as a Dimension.
Power BI
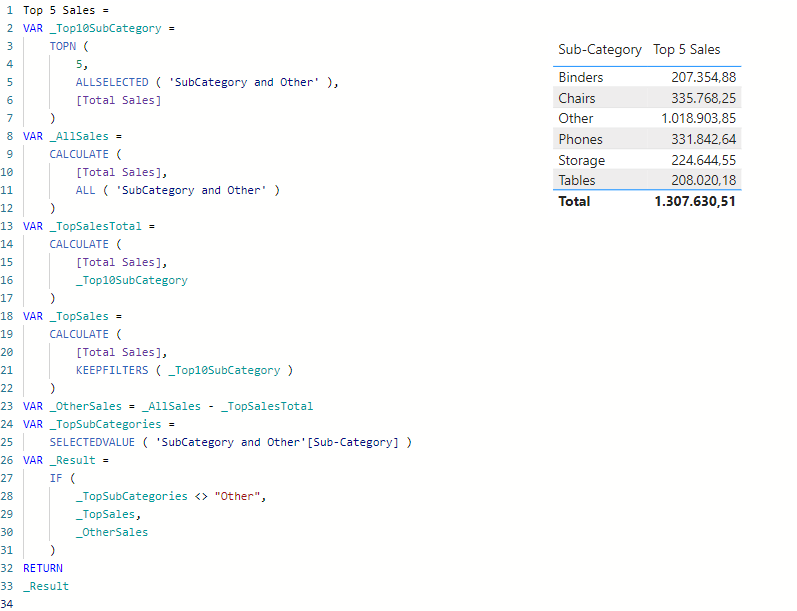
In Power BI i have to use the TOPN function. That alone only gives me the Top 5 Subcategories.

To get the related Sales values I need to use this in a CALCULATE function.

But that only returns the overall Sales value for the Top 5 Sub-Categories for all Sub-Categories.
To add the Top 5 Sub-Categories to the filter context, I have to wrap the TOPN function with a KEEPFILTERS function.

Now I have my Top 5, but how do i get the value for all the other Sub-Categories? A Set function similar to Tableau does not exist.
As I mentioned earlier, this requires additional dataset preparation. To have a 'Other' value available, I need to create a Sub-Category table with an additional 'Other' field.
To do that I create a table with one column and one entry for 'Other'.

And then combine this table with a table containing all the other Sub-Category values.

Then it needs a relationship between the two tables.

To calculate the Sales amount for 'Other' I need to subtract the Sales amount of the Top 5 Sub-Categories from the overall Sales value.
For the end results i need another calculation for the Top 5 Sales amount that will keep the filter context.

In the final calculation I check use the SELECTEDVALUE function to assign the appropriate amounts.
For the value 'Other' it will assign the _OtherSales amount, for everything else the _TopSales amount.
Building the visual
Tableau
I just built a bar chart with the Calculated Field i created for the Top 5 and Other.

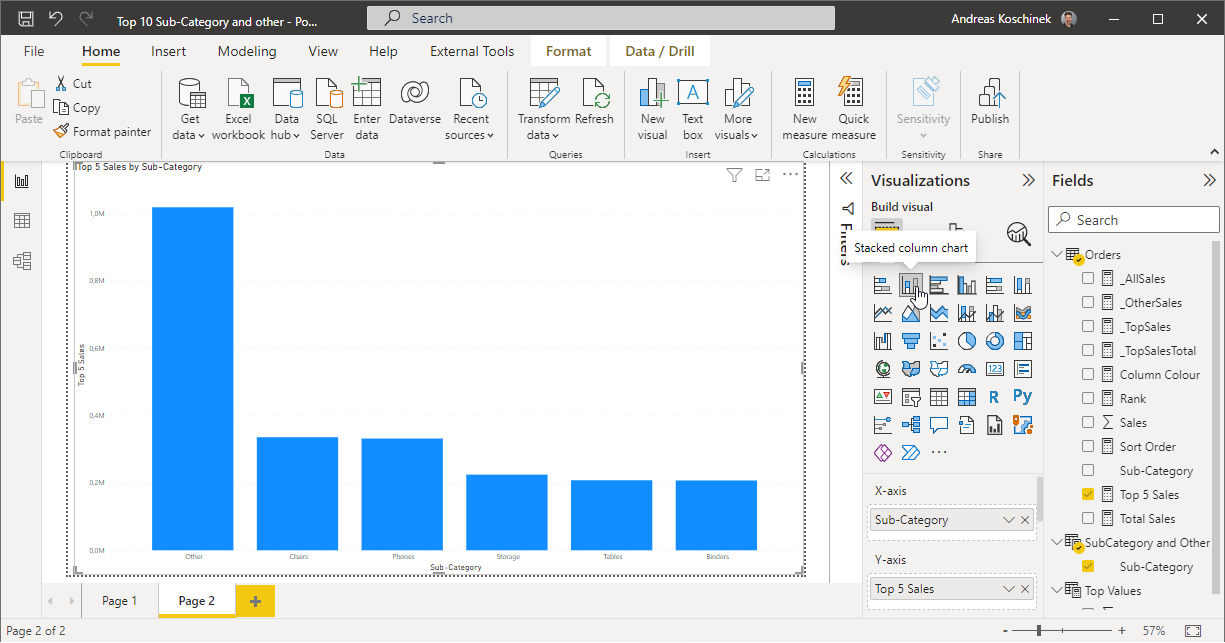
Power BI
I created a stacked column chart with the Sub-Category from my Sub-Category and Other table and the calculated Top 5 Sales value.
Applying the sort order
The bars should be sorted from highest to lowest value, with the Other category at the end.
Tableau
Here i added a calculated field that returns the Sales value for the Top 5 and a negative Sales value for Other.


Power BI
In Power BI I used the same logic. Applying a negative value of my Top 5 Sales calculation for Other in my SubCategory and Other table and for the rest a positive value.

In order to use this calculation to sort the bars, i need to add it to the Tooltip section. It will then be available to sort the x axis.

Applying colour to the bars
Tableau
I apply the Sub-Category Set to Colour and that's it.

Power BI
I have to create a new measure that applies a colour value for Other and another colour value to everything else.

This measure can then be referenced in conditional formatting for the column colours.


Comments
Post a Comment